
Introduction to Functional Data Analysis with R
What is Functional Data Analysis?
Functional Data Analysis (FDA) is a statistical method for analyzing data that can be represented as functions. This approach is particularly useful in fields such as biostatistics, econometrics, and environmental science. FDA allows us to analyze complex data structures, such as curves or shapes, in a coherent and efficient manner.
Key Concepts in FDA
- Functional Data: Data that can be represented as functions, such as curves or shapes.
- Basis Functions: Functions used to represent the functional data in a finite-dimensional space.
- Smoothing: The process of reducing noise in functional data to reveal underlying patterns.
- Functional Principal Component Analysis (FPCA): A method for reducing the dimensionality of functional data.
Implementation Example
Here's a simple example of how to perform FDA in R:
# Load necessary libraries
library(fda)
library(ggplot2)

# Generate sample functional data
set.seed(123)
n <- 100
t <- seq(0, 1, length.out = 100)
y <- matrix(NA, nrow = n, ncol = length(t))
for (i in 1:n) {
    y[i, ] <- sin(2 * pi * t + rnorm(1)) + rnorm(length(t), sd = 0.1)
}

# Create a functional data object
fd <- Data2fd(t, y)

# Perform FPCA
pca <- pca.fd(fd, nharm = 2)

# Plot the results
plot(pca)
Applications of FDA
FDA has a wide range of applications, including:
- Analyzing growth curves in biology
- Modeling temperature profiles in environmental science
- Studying the evolution of financial time series
- Understanding the dynamics of complex systems
Advanced FDA Techniques
Functional Regression Models
Functional regression extends traditional regression to cases where either the predictors or the responses (or both) are functions:
# Functional linear model example
library(fda)
data(CanadianWeather)

# Create temperature and precipitation functional data objects
tempfd <- CanadianWeather$dailyAv
precipfd <- CanadianWeather$dailyPrecip

# Fit functional linear model
flm <- fRegress(tempfd ~ precipfd)
Functional Clustering
Clustering functional data helps identify patterns and group similar functions:
# Functional clustering example
library(funHDDC)

# Simulate data
set.seed(456)
curves <- simulate_functional_data(n_curves=100, n_clusters=3)

# Perform clustering
clusters <- funHDDC(curves, K=3, model="AkjBk")
plot(clusters)
Common Challenges in FDA
- Choosing appropriate basis functions - Selecting the right basis functions (e.g., Fourier, B-splines) depends on the nature of your data
- Determining optimal smoothing parameters - Too little smoothing retains noise, while too much loses important features
- Handling sparse or irregularly sampled data - Special techniques are needed when observations are not taken at regular intervals
Resources for Learning FDA
For those interested in diving deeper into FDA, consider these resources:
- "Functional Data Analysis with R and MATLAB" by Ramsay, Hooker, and Graves
- The
fdapackage documentation in R - Online courses on functional data analysis from platforms like Coursera
Conclusion
Functional Data Analysis is a powerful tool for analyzing complex data structures. By leveraging the power of R and its libraries, you can easily implement FDA techniques and gain valuable insights from your data.
Related Posts
More content from the Statistics category and similar topics

Learn the fundamentals of Functional Data Analysis and how to implement key techniques using R.
Shared topics:
A simple explaination of projectiong points onto a hyperspace.
Shared topics:
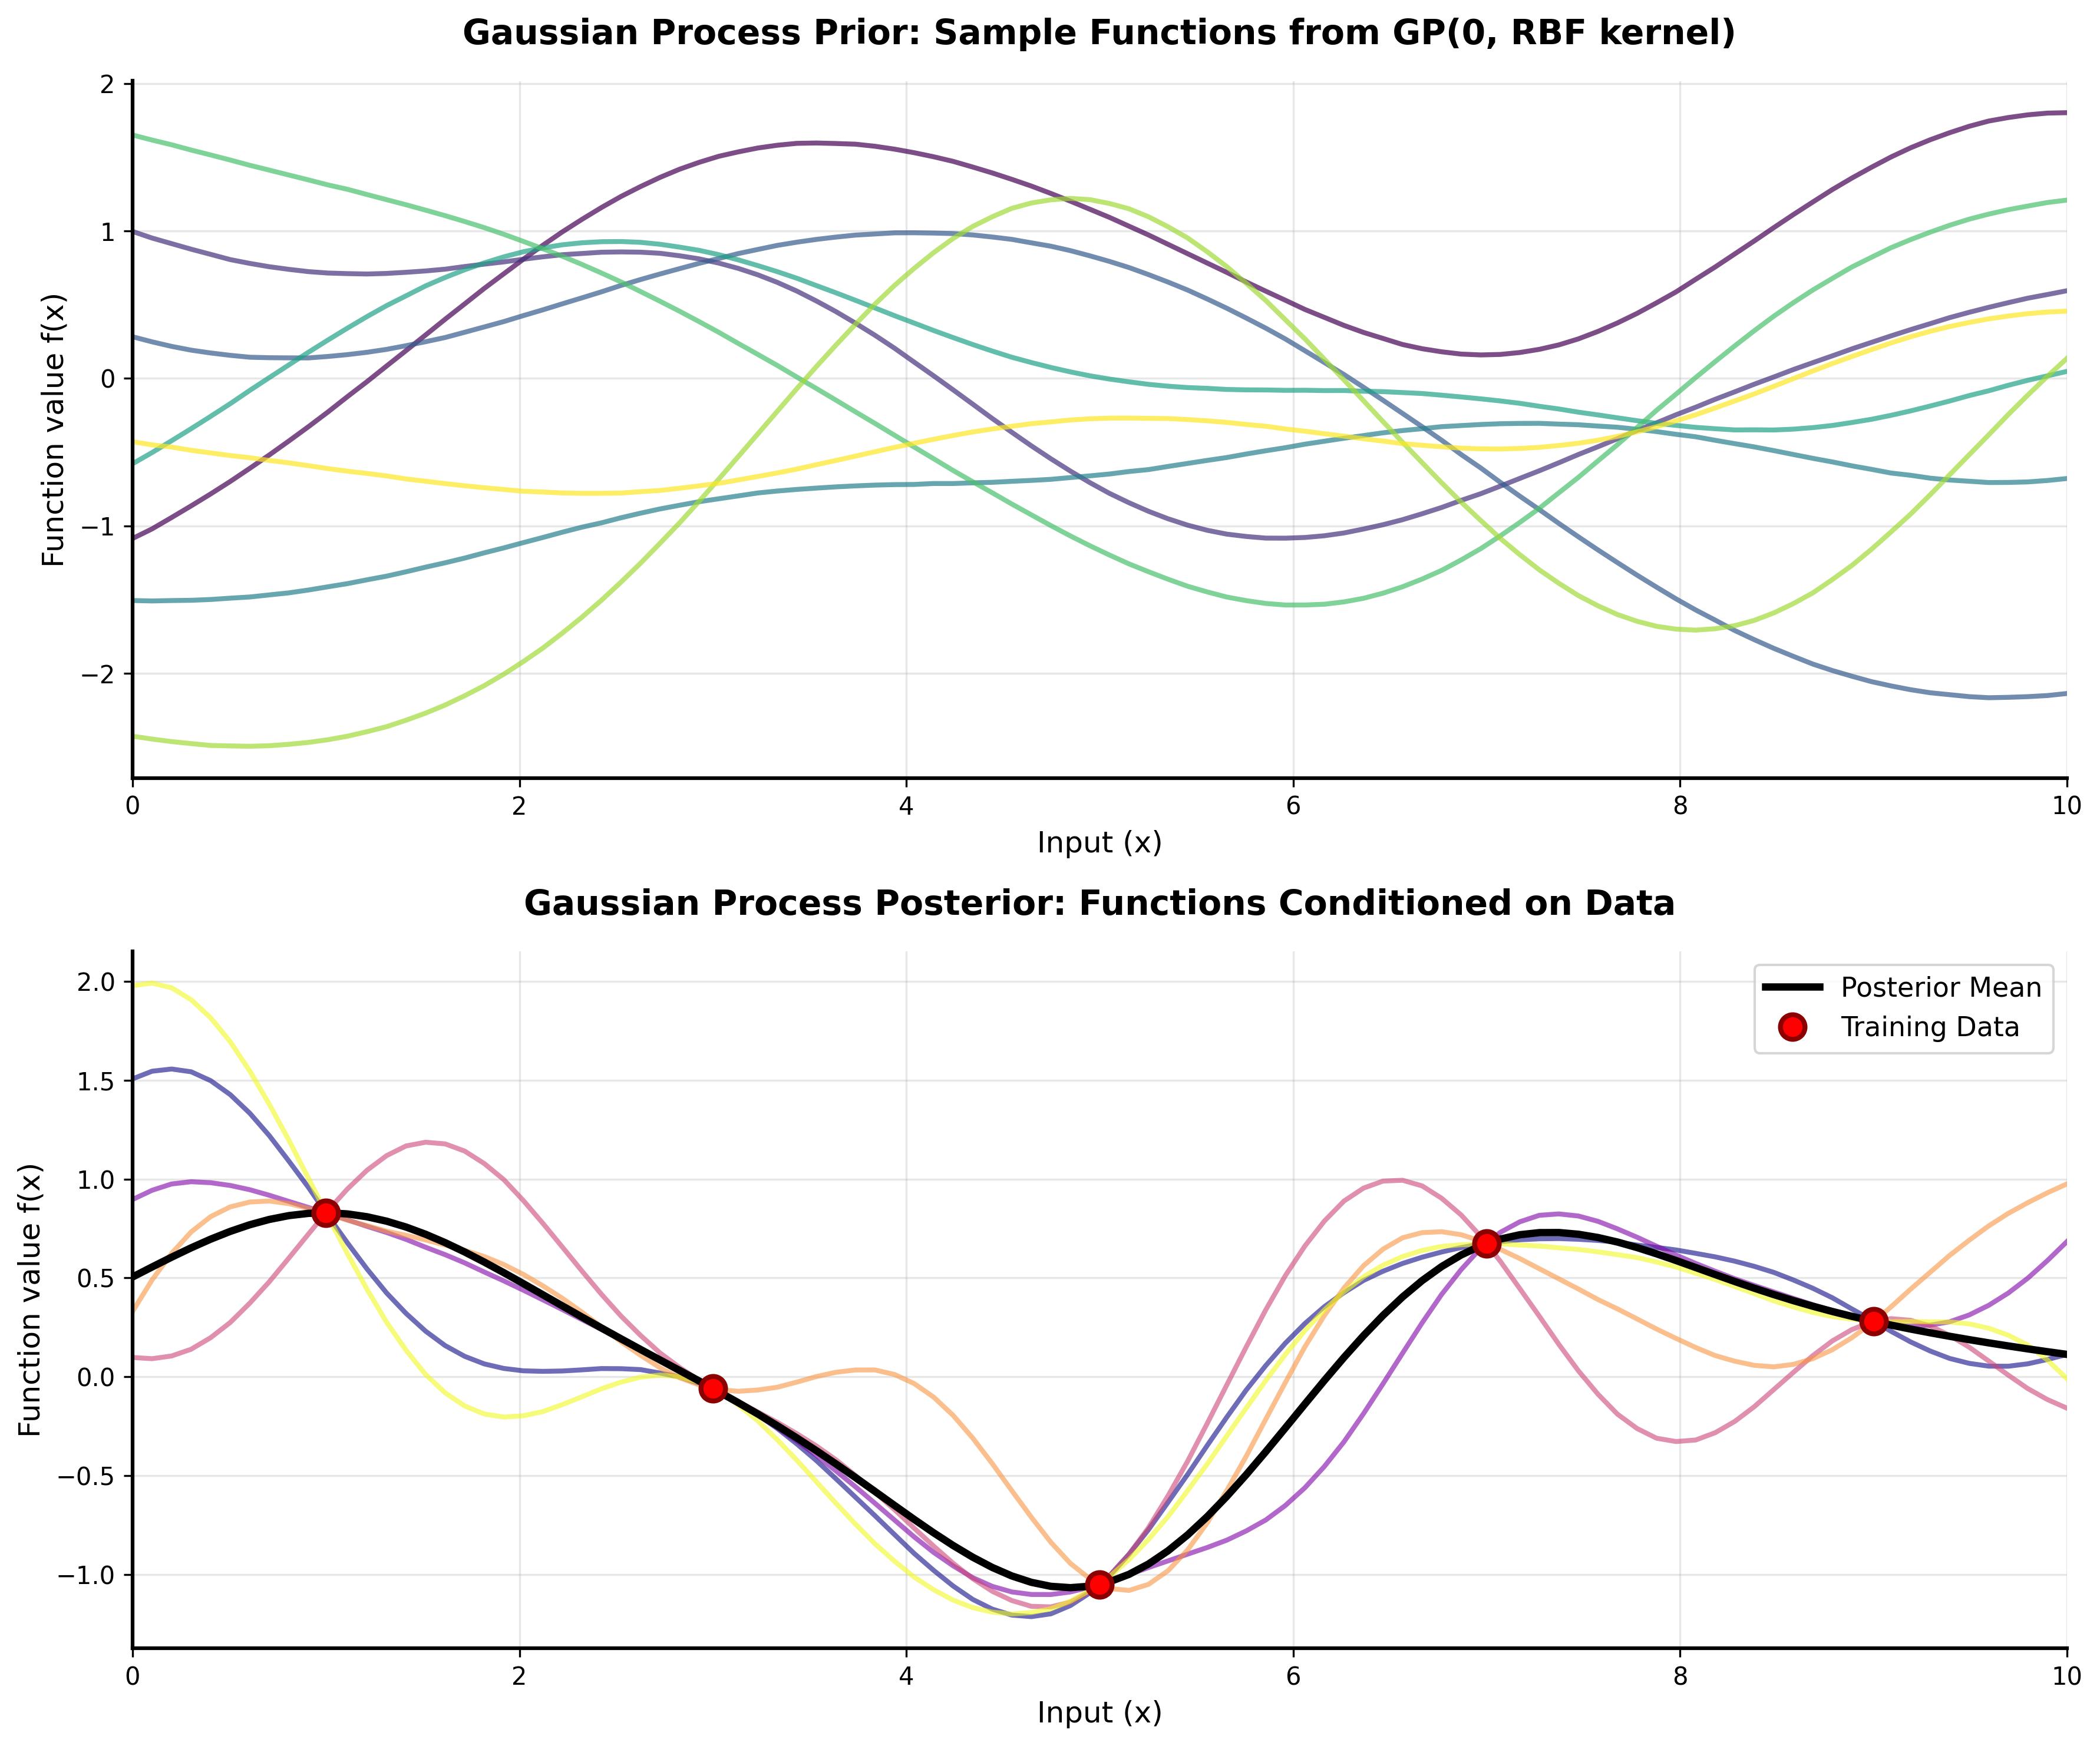
A comprehensive tutorial on understanding Gaussian Processes with interactive visualizations and practical examples.
Shared topics: